Calcwright is a worksheet in the style of Mathcad. Math and text go anywhere on the page, and the math is worked out top to bottom, then left to right, by an engine on a thread of its own.
The worksheet
Math on paper, typeset as you type.
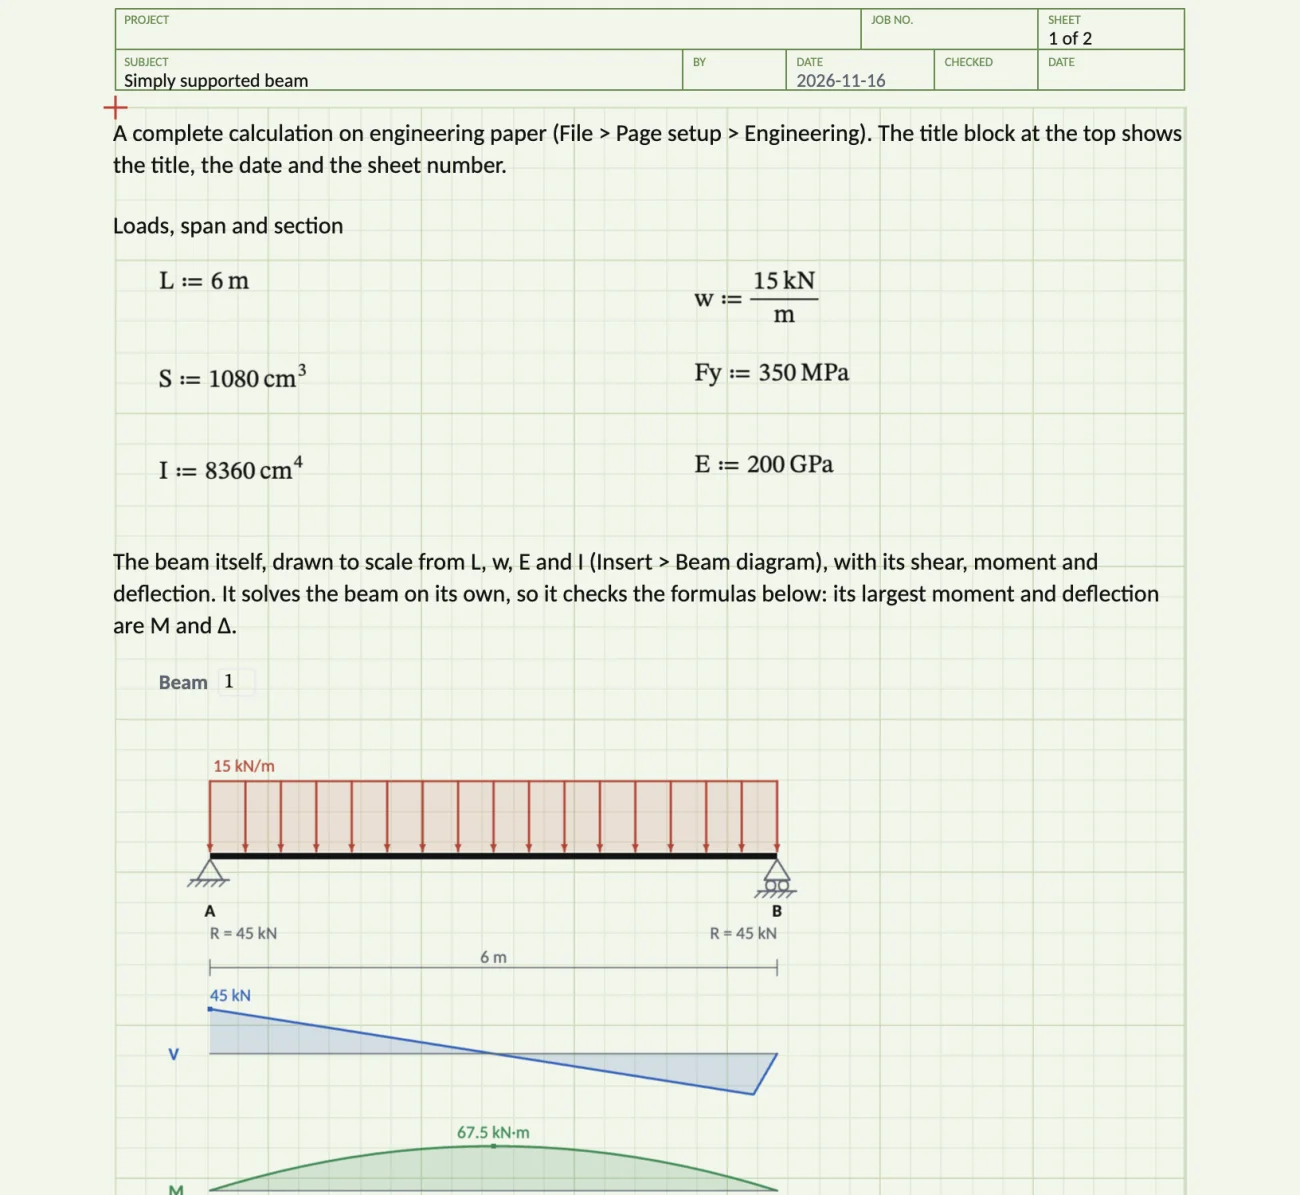
Click the page to put the crosshair there and type. : becomes ≔ and * becomes ·. Fractions stack, exponents rise and roots go under a radical, as in Mathcad. Text regions explain the calculation and print with it.
Letter, Legal, Tabloid, A4 or A3, plain or engineering paper
The pad's title block: project, job, sheet, by, checked
Areas that collapse and lock, and references to other worksheets
Print, or save as PDF, with vector math and plots
Math too wide for the page fitted to it: long vectors shortened, long equations broken
Units and design checks
Every value carries its units.
Type 12kN/m, 3ft or 30deg. Units convert and cancel, and a wrong one is an error. Results show in the unit that suits their size, 250 MPa or 15.1 mm, or in the unit you type after Tab. Switch the sheet to US customary units and every result follows.
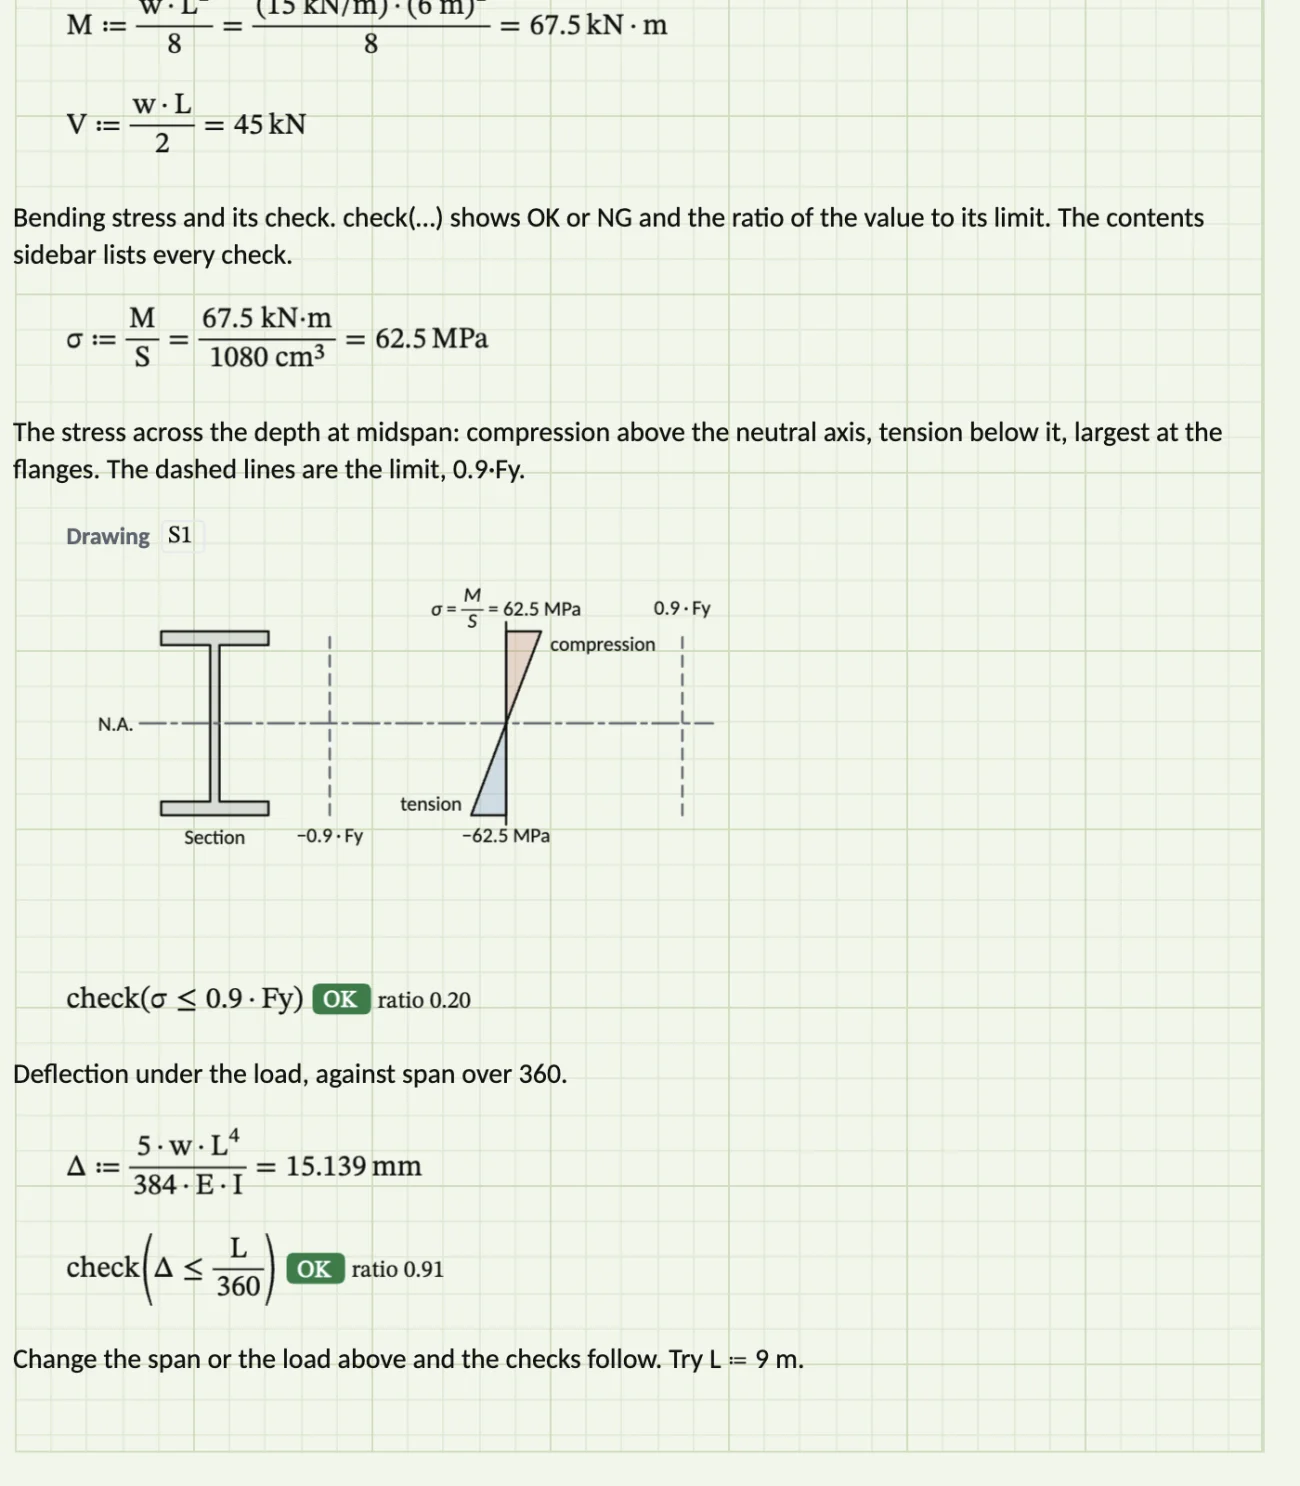
check(σ<=0.9*Fy) shows OK or NG, with its ratio
Show the working: the formula, the values in place, the answer
Traditional notation, as a textbook or a report sets it
Your own units and unit sets, saved with the sheet
Plots and math
Plots, matrices, calculus and symbolic math.
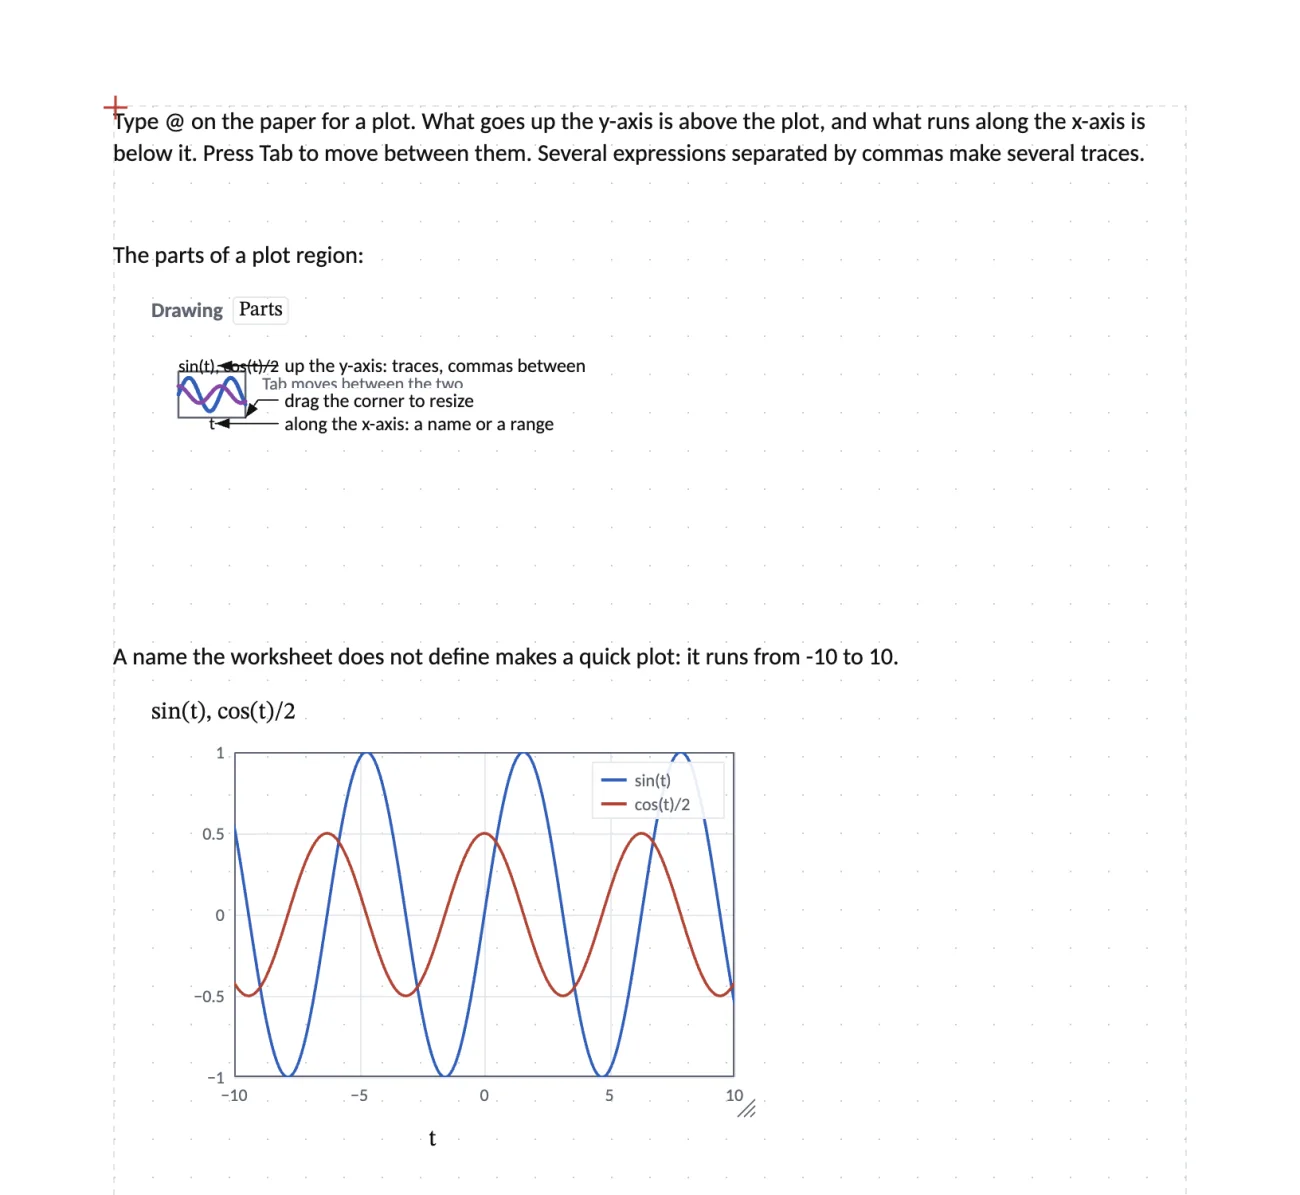
Type @ for a plot. Ranges, vectors and matrices with units in each element; integrals, derivatives, sums and roots; solve blocks for several equations in several unknowns; and the symbolic arrow, →, for exact answers.
Programs with if, for and while, as Mathcad writes them
Statistics, curve fitting, interpolation and lookup
Tables, typed or pasted from a spreadsheet or a CSV file
Complex numbers, units and all
Structural
Steel sections, beams, frames and trusses.
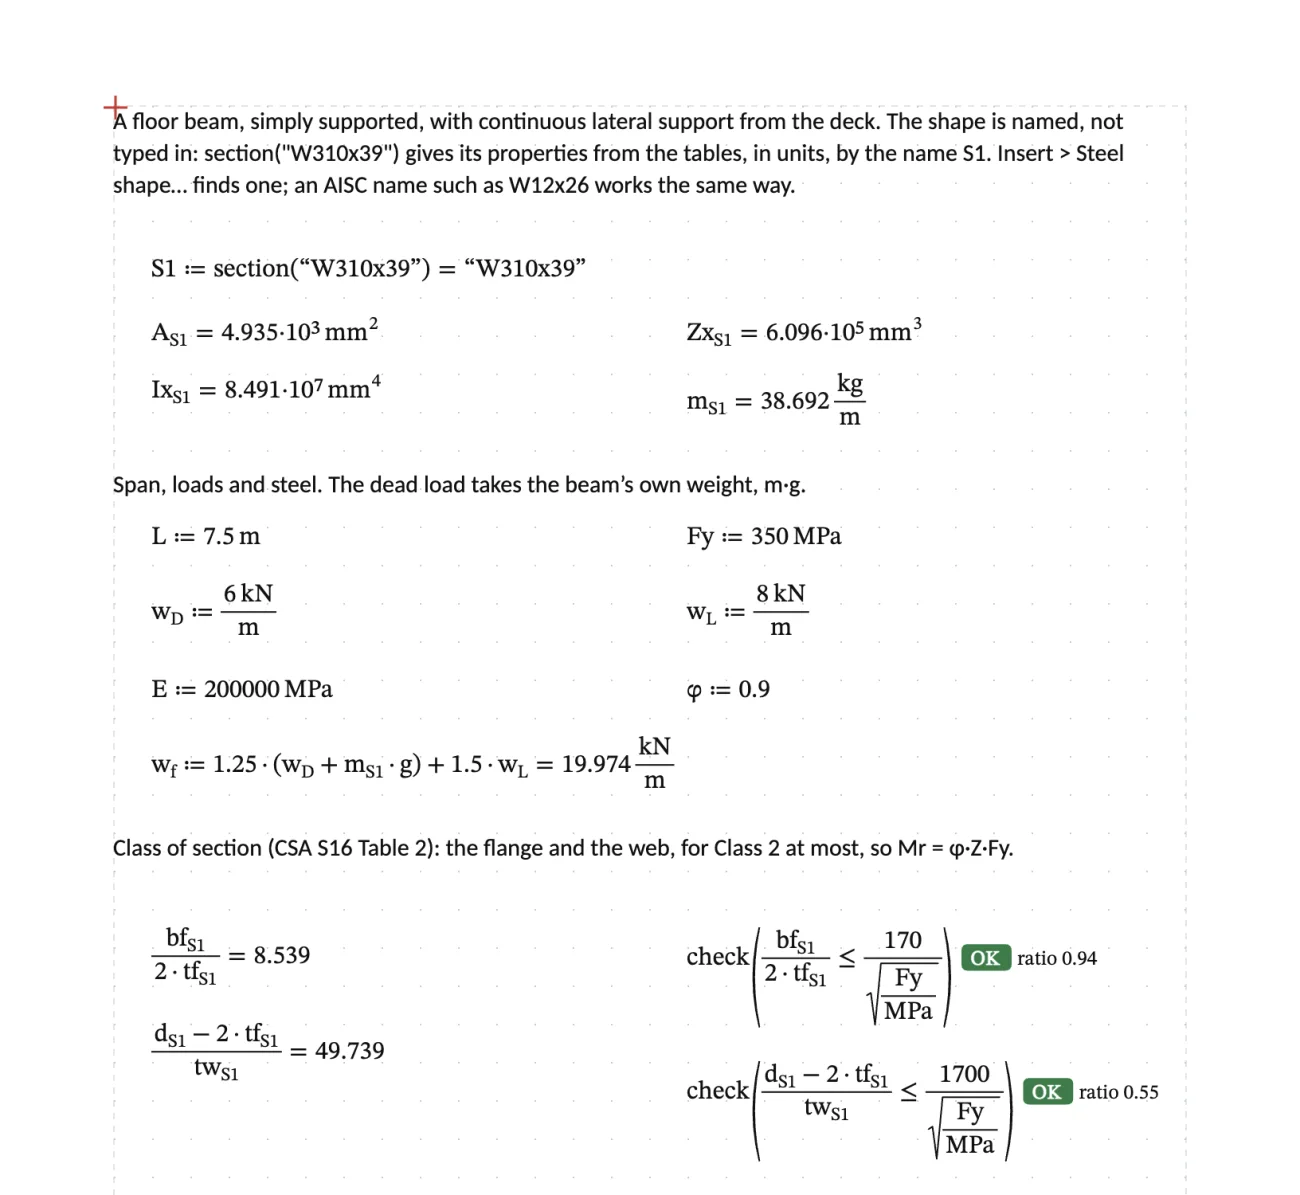
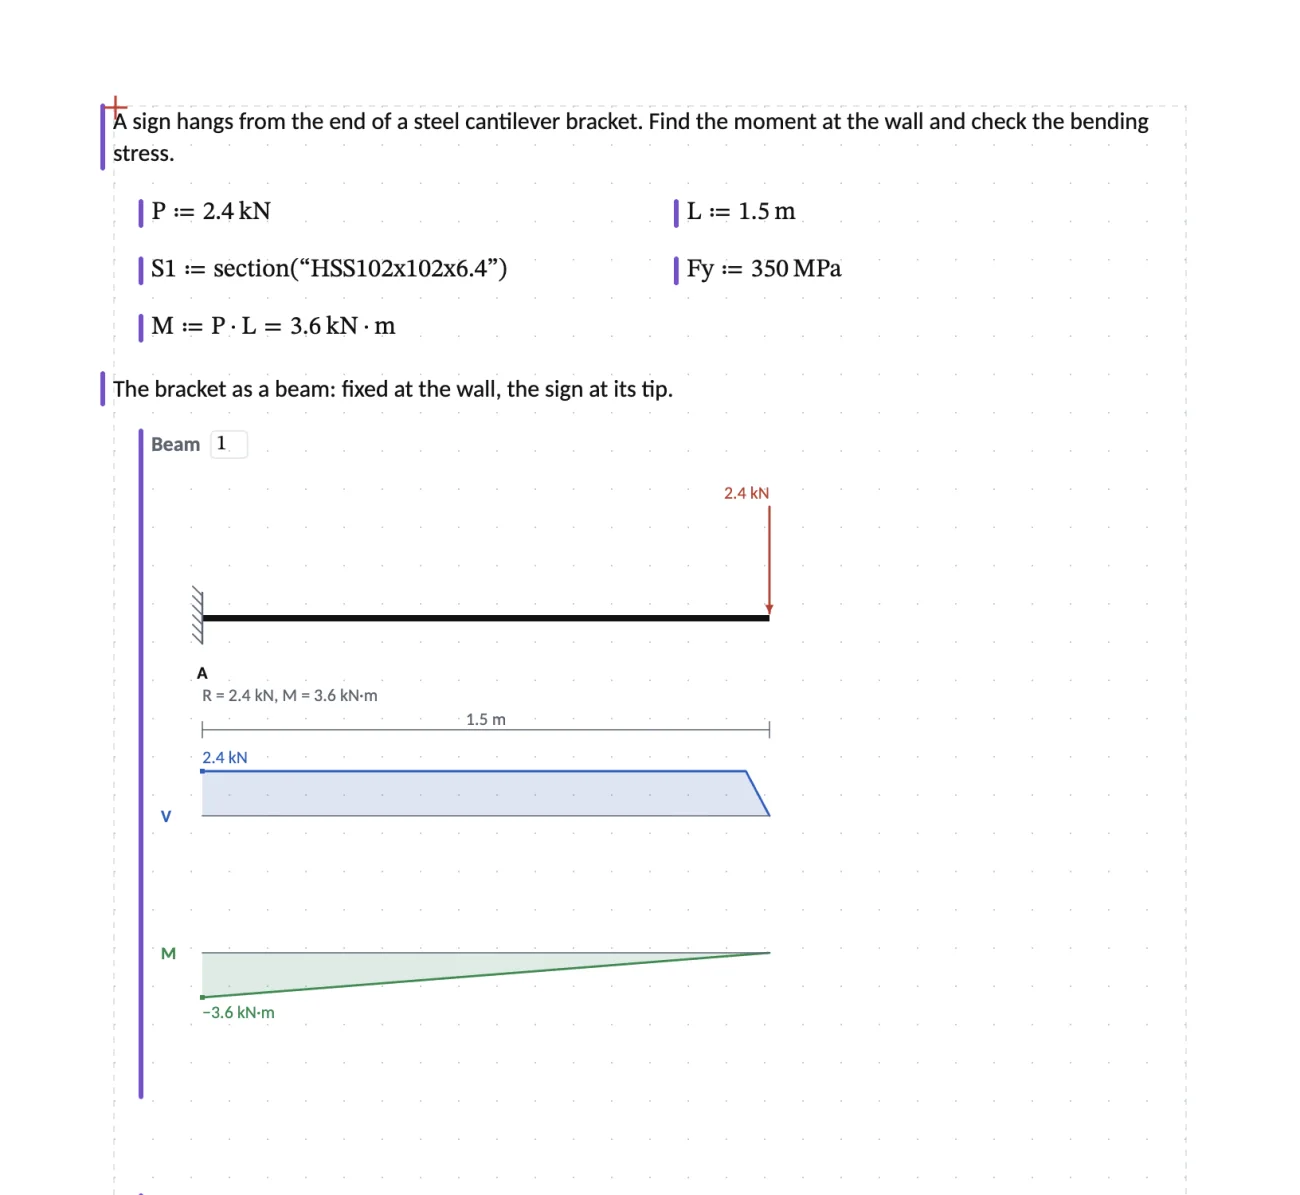
S1:section("W310x39") brings in a rolled shape's properties by name. Insert a beam diagram, or a frame or truss diagram, and it is drawn to scale and solved by the direct stiffness method, with reactions, shear, moment and the deflected shape. Their results are names the math below can use.
AISC W, C and HSS in inches and millimeters (Shapes Database v16.0)
CSA W, C and HSS by CISC's names
Size it: the lightest shape for which every check is OK
Drag a support, a load or a node, and the sheet follows
Drawings
Drawings that follow the math.
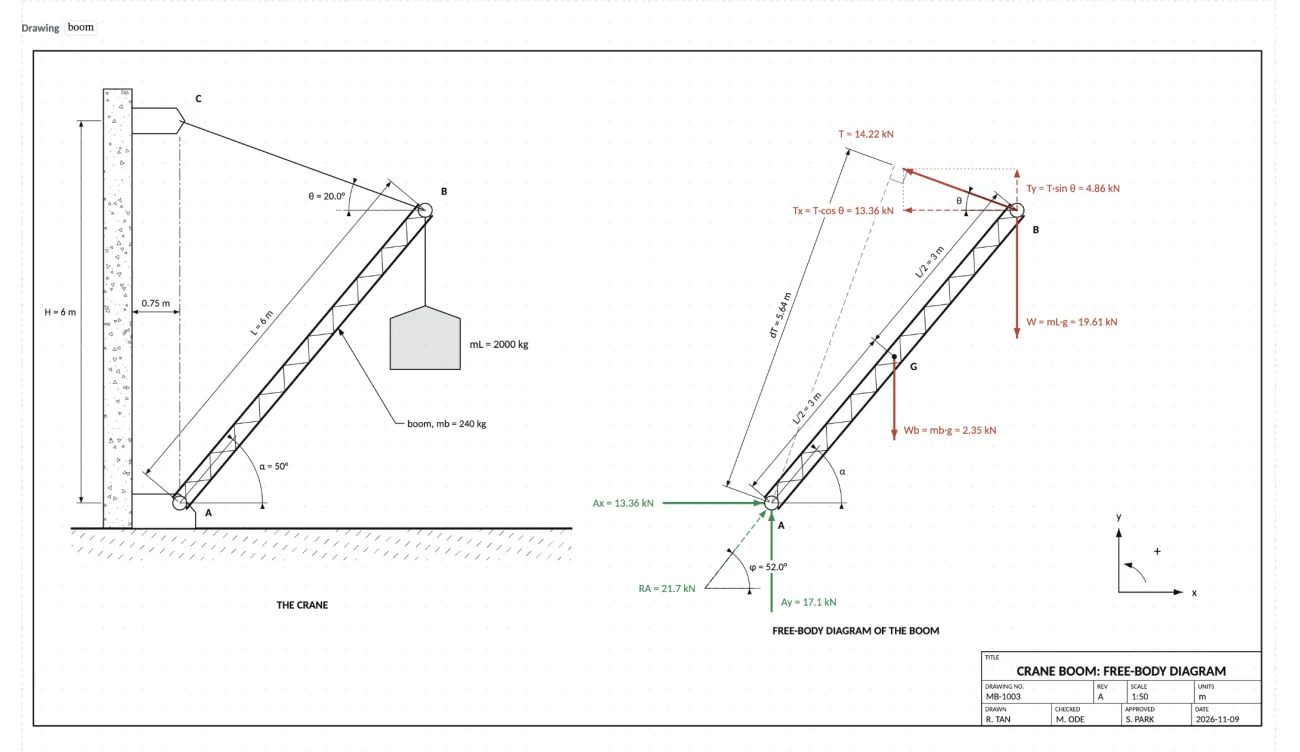
A drawing is lines, arcs, text and dimensions whose every coordinate is an expression read against the sheet. A section b wide redraws when b changes, and its labels show the values. Insert → Figure has every drawing from the examples ready to drop in.
To scale, in the unit you choose
Symbol libraries whose parts are made from values
SVG and DXF in, SVG and DXF out, through your AI
For teachers
One question, other numbers for each student.
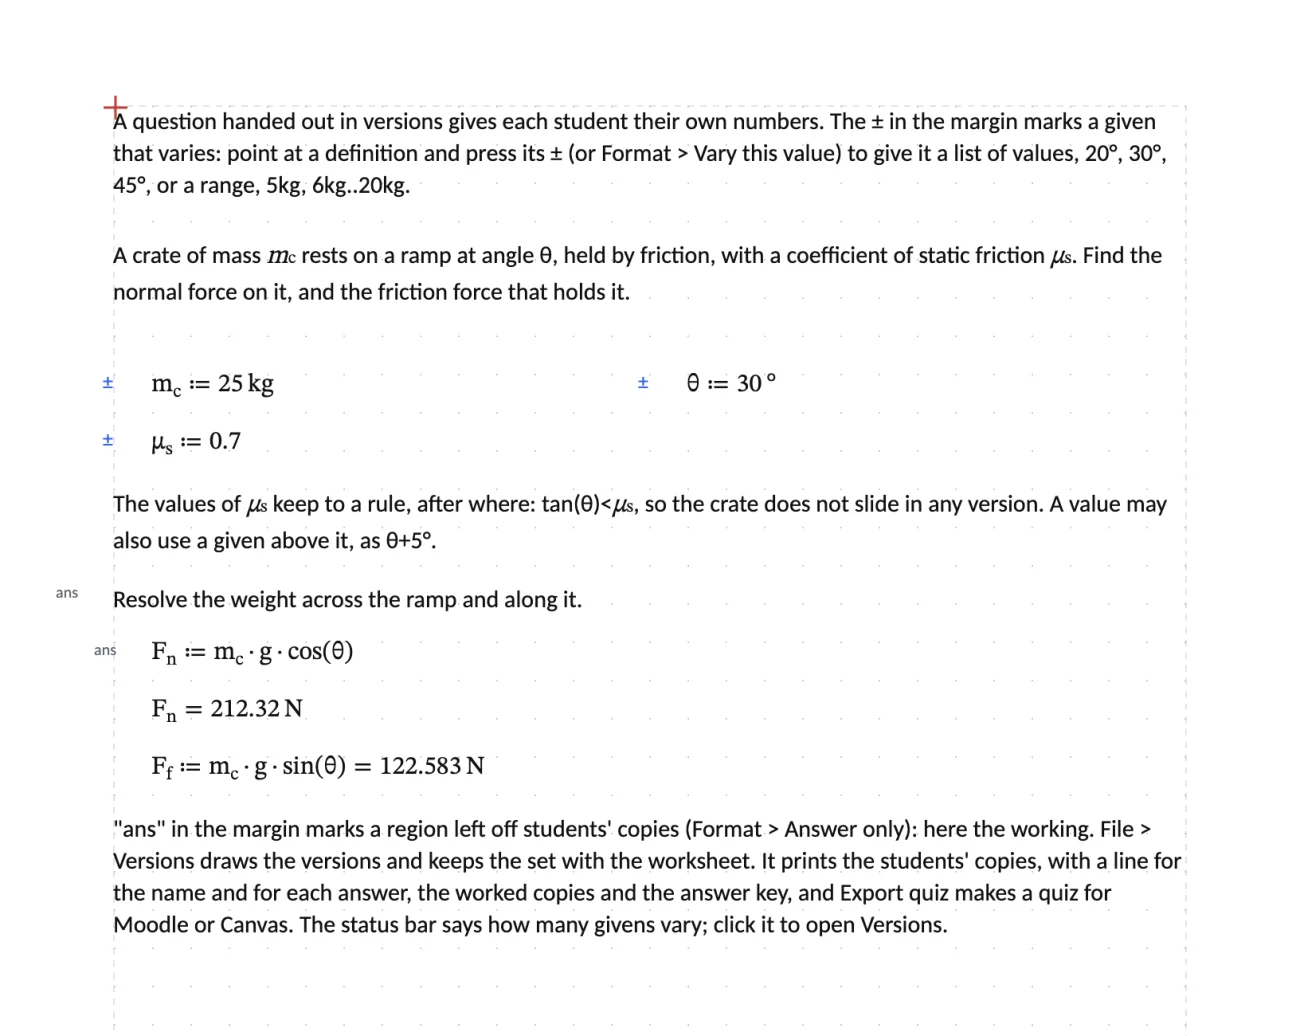
Mark the givens that vary, and the values they take. Mark the answers to leave off students' copies. File → Versions draws a set, prints students' copies with a name line, worked copies and the answer key, and exports a quiz for Moodle or Canvas. It works without any AI.
Any version on the paper in one click, worked out, with ‹ and › to step through the set
Values may depend on each other, with a rule after where
Moodle XML or Canvas QTI, each student their own numbers
Bring your own AI
Your AI, working the sheet in front of you.
Calcwright never calls an AI service itself. It is an MCP server on your computer, and the AI app you already use connects to it. Your AI reads the worksheet, adds and changes regions, sees its own drawings as pictures to correct them, and sizes steel, all while you watch.
Prompts for drawing a problem, a free-body diagram, versions and checking
What your AI changed is marked until you have looked
 Calcwright